
vastorbit.machine_learning.memmodel.cluster.BisectingKMeans.plot_tree
- BisectingKMeans.plot_tree(pic_path: str | None = None, *args, **kwargs) Source
Draws the input tree. Requires the graphviz module.
- Parameters:
pic_path (str, optional) – Absolute path to save the image of the tree.
*args (Any, optional) – Arguments to pass to the
to_graphvizmethod.**kwargs (Any, optional) – Arguments to pass to the
to_graphvizmethod.
- Returns:
graphviz object.
- Return type:
graphviz.Source
Examples
Import the required module.
from vastorbit.machine_learning.memmodel.tree import BinaryTreeClassifier
We will use the following attributes:
# Different Attributes
children_left = [1, 3, None, None, None]
children_right = [2, 4, None, None, None]
feature = [0, 1, None, None, None]
threshold = ["female", 30, None, None, None]
value = [
    None,
    None,
    [0.8, 0.1, 0.1],
    [0.1, 0.8, 0.1],
    [0.2, 0.2, 0.6],
]
classes = ["a", "b", "c"]
Let’s create a model.
# Building the Model
model_btc = BinaryTreeClassifier(
    children_left = children_left,
    children_right = children_right,
    feature = feature,
    threshold = threshold,
    value = value,
    classes = classes,
)
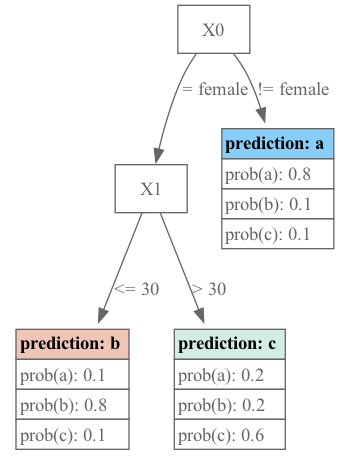
Let’s draw the input tree.
model_btc.plot_tree()
Important
For this example, a specific model is utilized, and it may not correspond exactly to the model you are working with. To see a comprehensive example specific to your class of interest, please refer to that particular class.